Our Services

A logo featuring three green overlapping triangles forming a larger triangle, with the words 'AlphaPart Scientific' in a black box below.

It all begins with an idea. Maybe you want to launch a business based on an idea or maybe you want to create innovation within your established profession. Then you may have a creative project to share with the world.

We can effectively help you research and create a strategy on how to make it a reality!

Our company can help you take a path that leads to innovation and at the same time financial success.

Looking up at a cluster of tall modern glass skyscrapers against a cloudy sky.

Basic

We offer expert tech and innovation leads. If you are seeking a creative direction or just starting from scratch - We provide expert guidance in technology and innovation to help your business thrive and stay ahead in a rapidly evolving market.

Unlock innovation. Choose AlphaPartScientific.

Intermediate

We carefully assess the scientific factors that drive your company’s innovation. We go beyond creativity. We help you make a clear, science-based plan and strategy.

Elevate your vision. Choose AlphaPartScientific.

Advanced

We offer many skills, all tailored to fit your company’s unique path.

We provide expert knowledge in various engineering and science areas. We build lasting technology advantages and offer ongoing support to help you succeed.

Choose AlphaPartScientific.

Whatever it is, the way you create and showcase your work can make all the difference.

Graph showing X-ray photoelectron spectroscopy data with peaks for silver (Ag) at different binding energies, indicating the presence of silver oxides and metallic silver, with annotations for satellite ranges and oxygen content.
3D plot showing the trajectory of a resulting wave from four sinusoidal waves. The plot has axes labeled 'Time (μs)', 'Sine Sum Amplitude', and 'Cosine Sum Amplitude', with multiple sinusoidal wave paths depicted.
Cover page of a report titled 'Innovation and R&D - Technology Report' with a split background of orange flower petals on the left and green tropical leaves with a yellow flower on the right.
Diagram of a circular cluster with sections marked as 70% and 30%. Arrows indicate the cluster's interaction with X-rays. The diagram shows three green circles and three yellow circles in a triangular formation inside the cluster. Labels indicate axes for X-rays and Z.
3D plot showing the trajectory of sine and cosine sums from four equal-amplitude tones. The axes are labeled Time in microseconds, Sine Sum Amplitude, and Cosine Sum Amplitude, with blue wireframe lines illustrating the amplitude variations.
A table listing disadvantages of using superheated steam for heating, including reduced productivity, larger heat transfer surface needed, variable steam temperature, sensitive heat used to transfer heat, and very high temperature requirements. It also discusses heat energy and transfer efficiency.
A three-panel graph showing the sum of sine and cosine waves and their combination. The top graph displays the sum of sine waves, the middle graph shows the sum of cosine waves, and the bottom graph illustrates the combined signal, all plotted against time in microseconds.

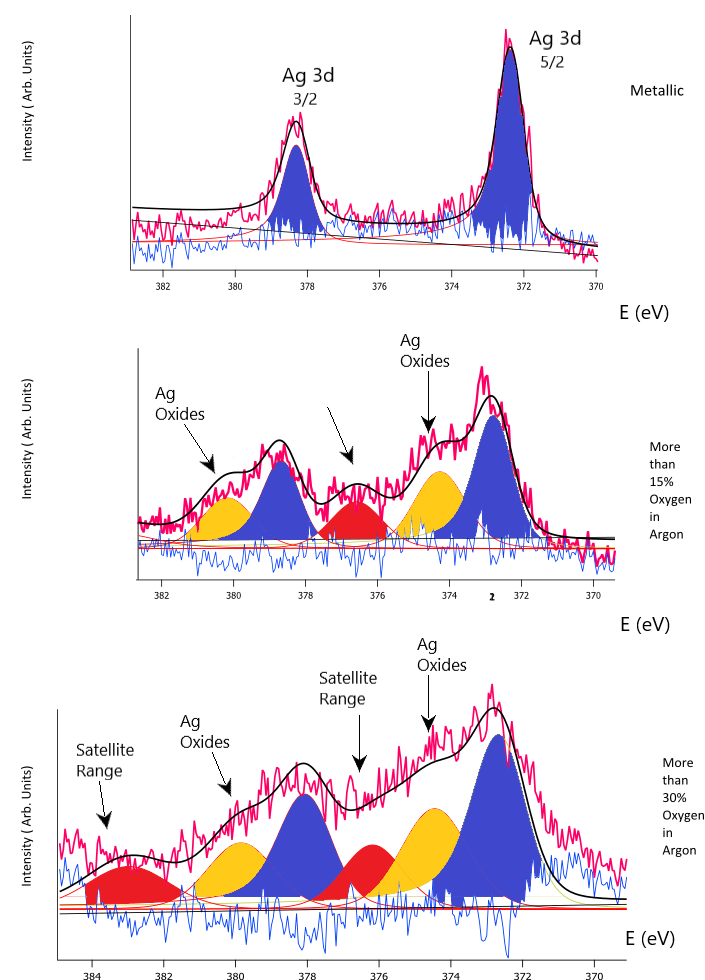
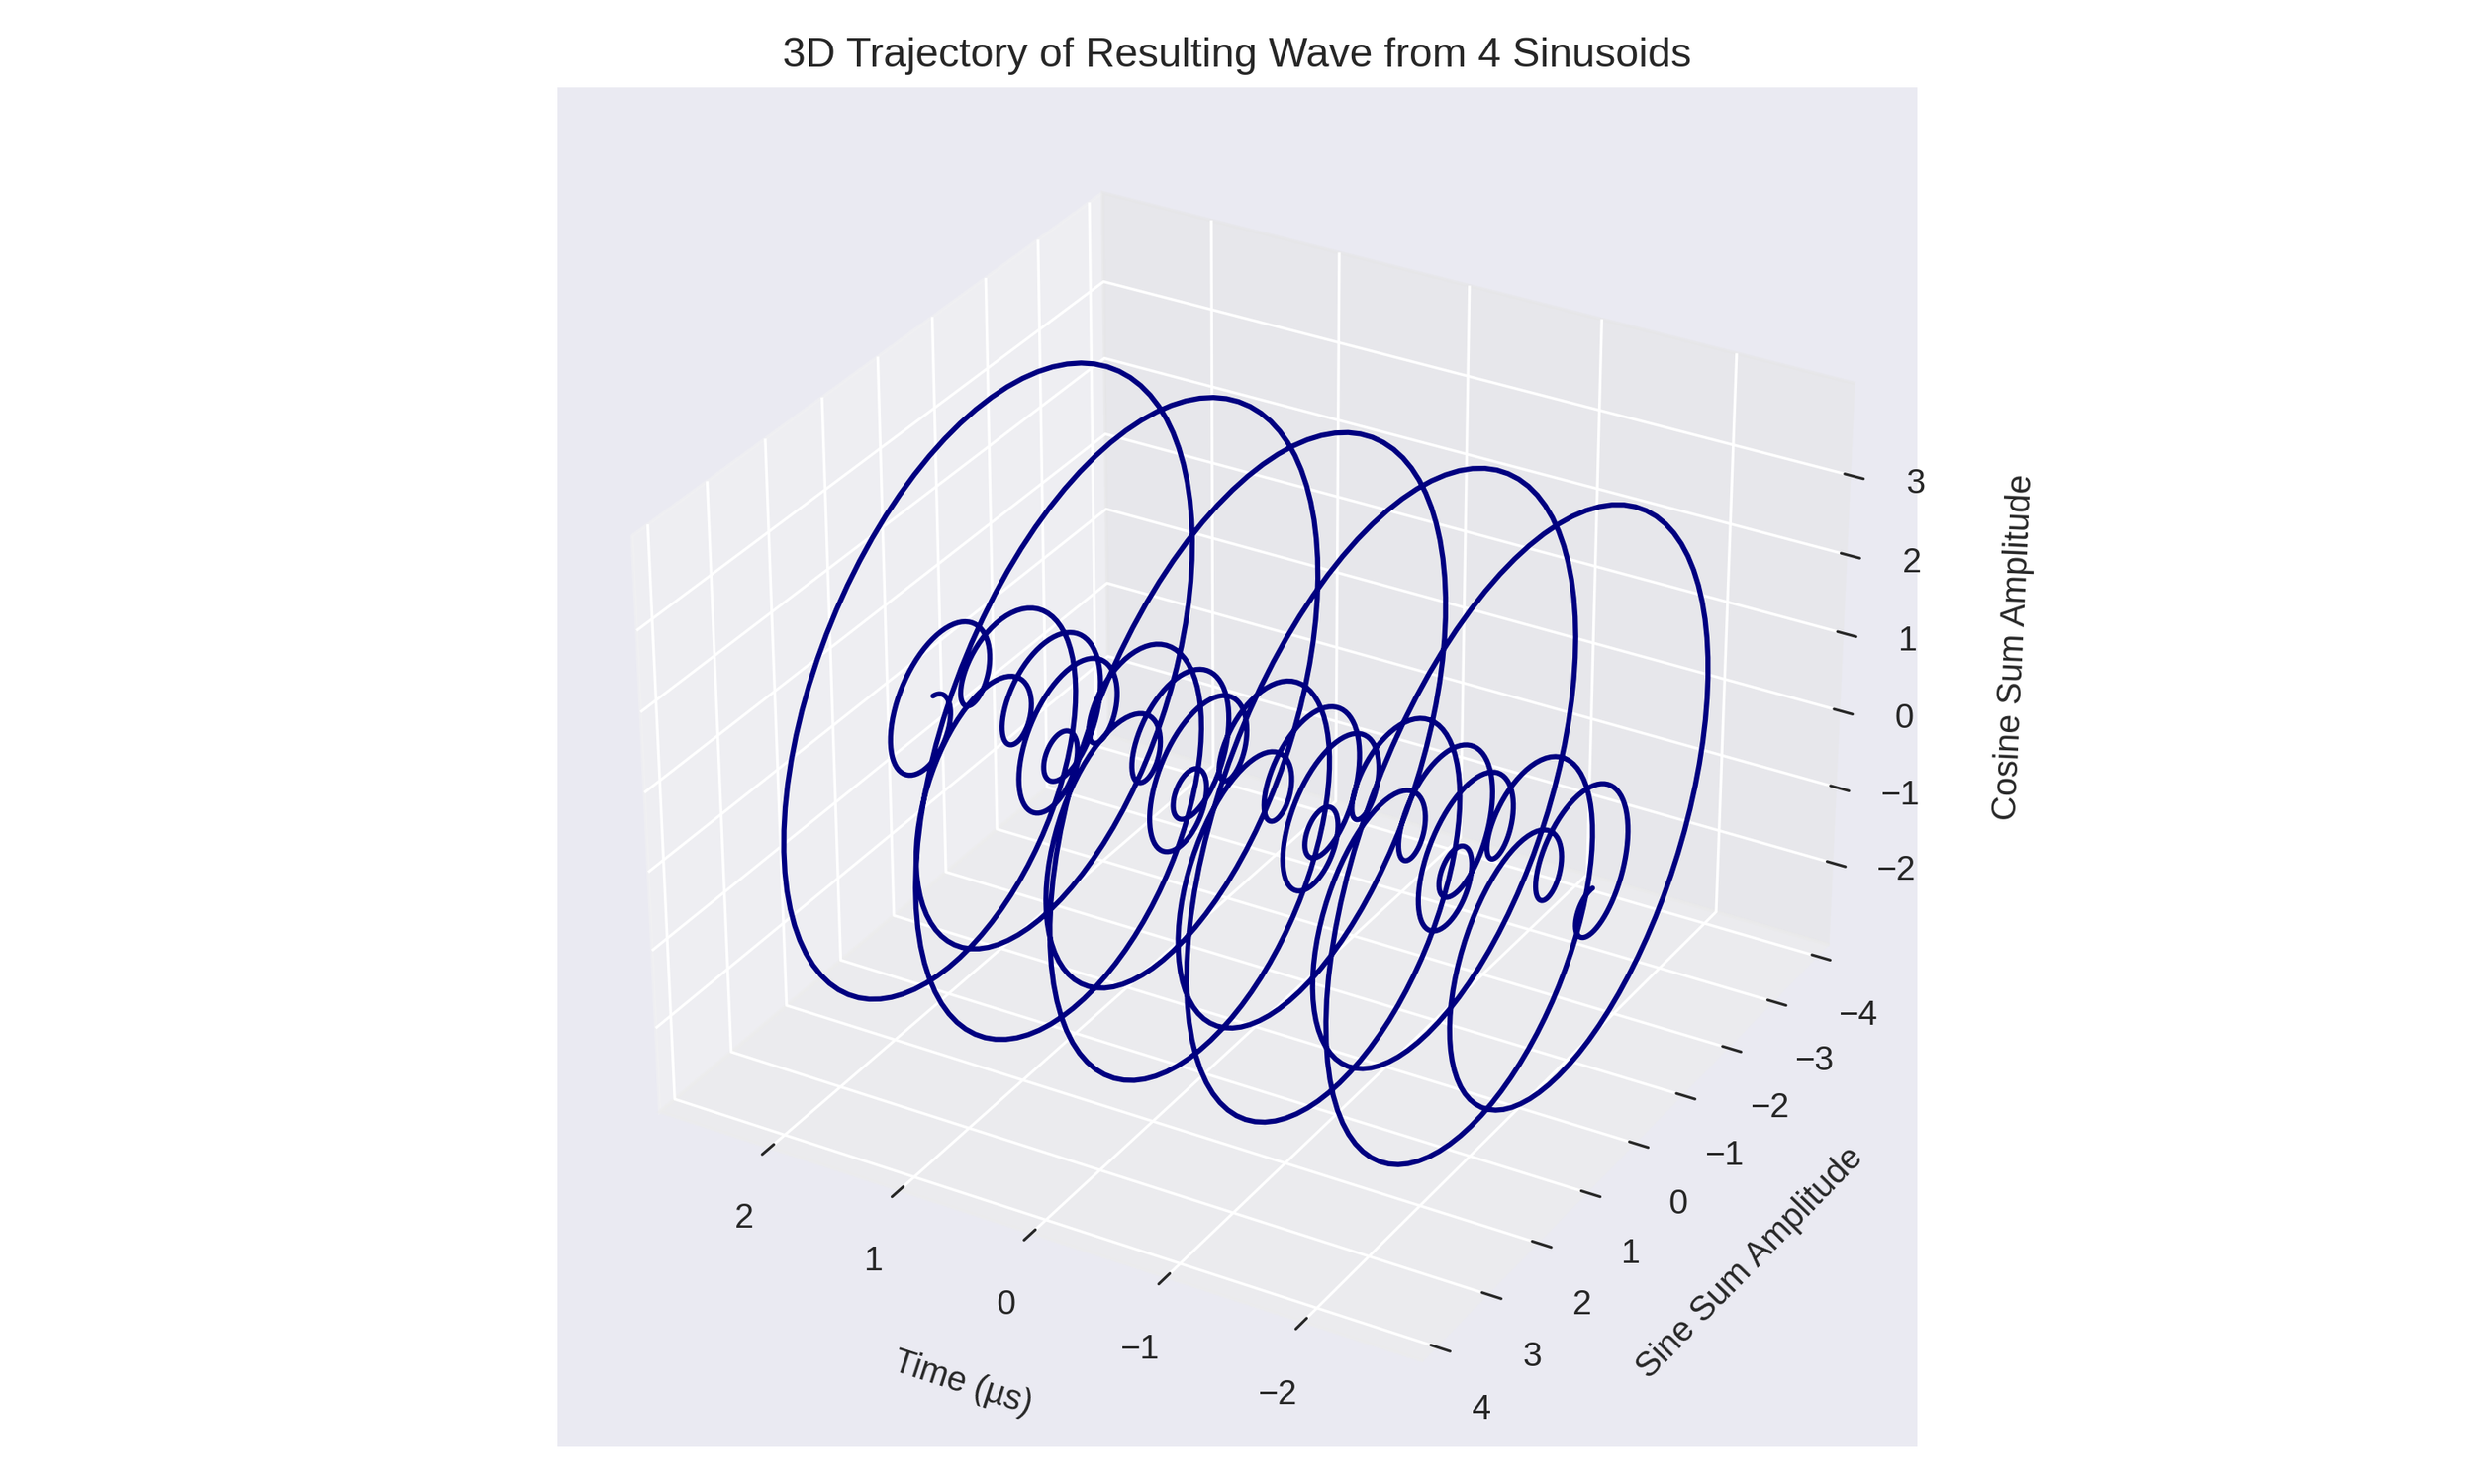
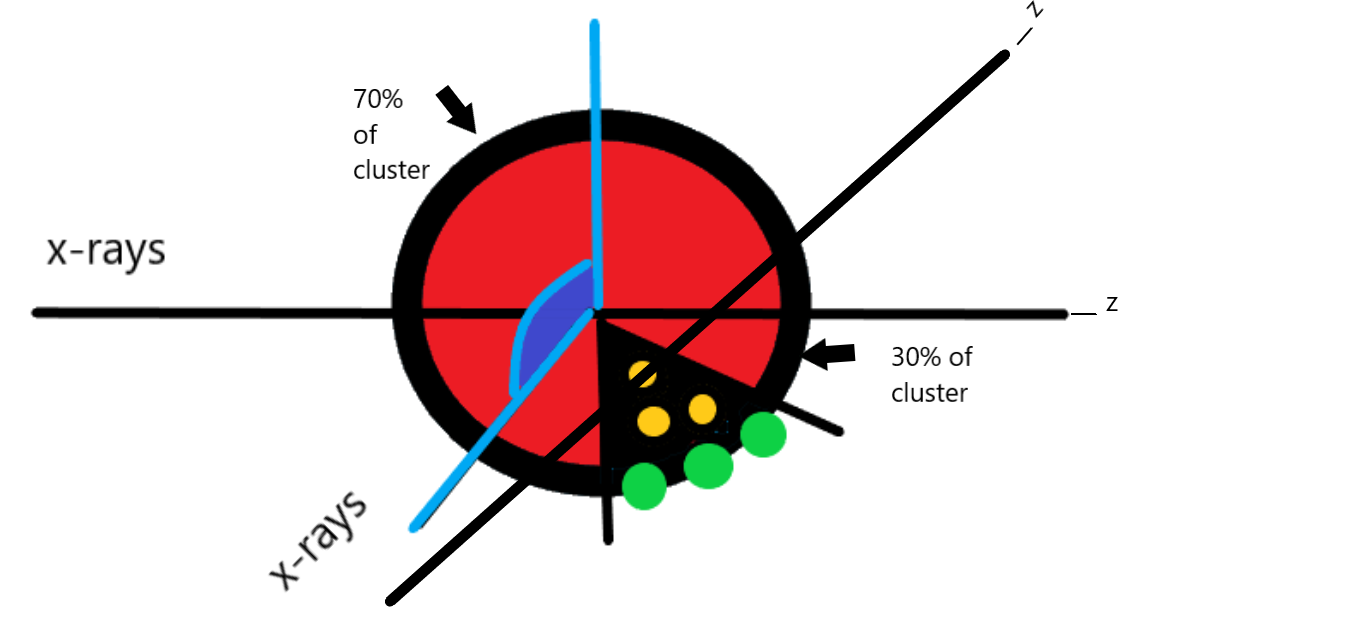
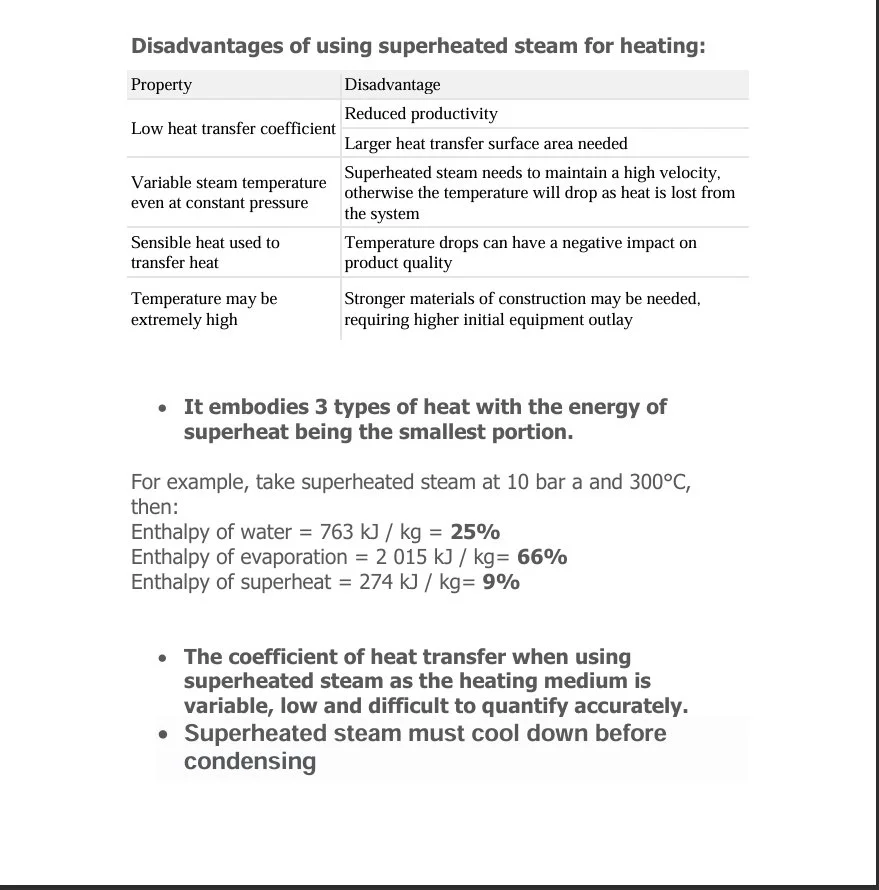
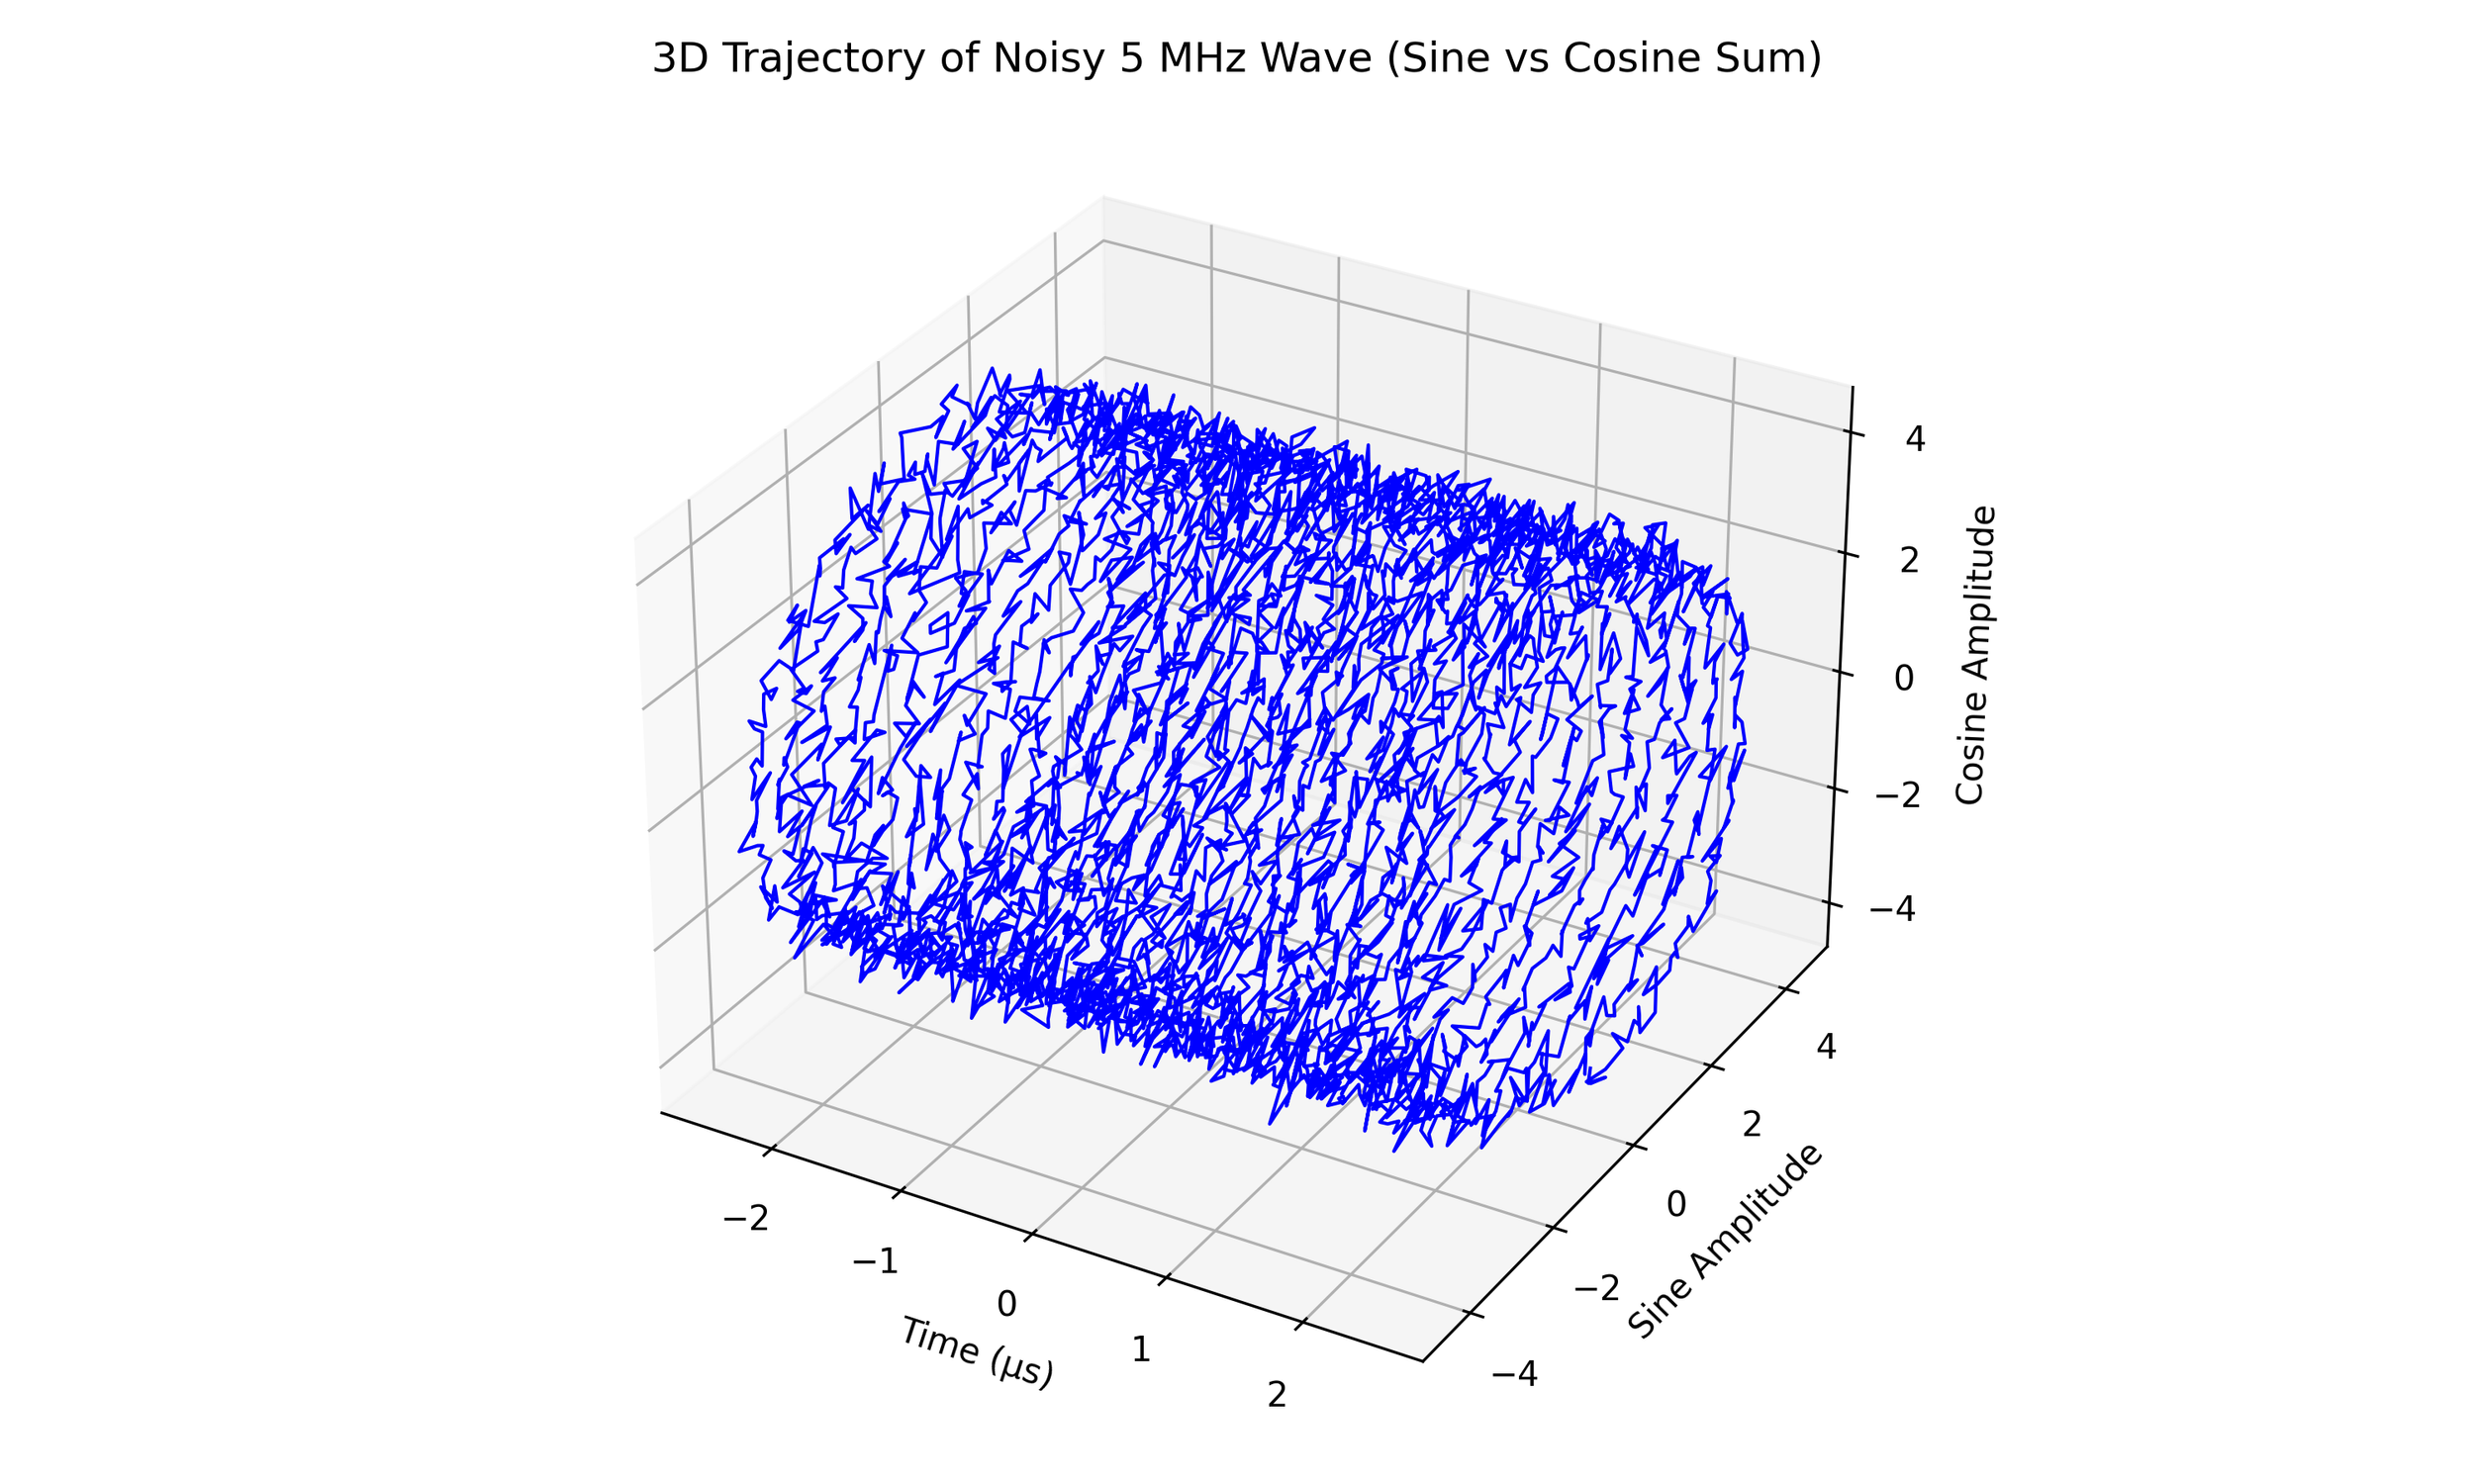
These materials represent the type of technical outputs produced during our research and engineering work. Each drawing, graph, and document is prepared according to the requirements of the project and reflects the level of detail clients can expect when engaging our services.

3D plot showing noisy 5 MHz wave with sine and cosine sum, labeled axes: Time in microseconds, Sine Amplitude, Cosine Amplitude, and graph title.
Work With Us